JSUNIL TUTORIAL CBSE MATHS & SCIENCE
Let us be friend !
  • HOME
    • STUDY ZONE
    • Think Zone
    • Board Papers Solutions
    • CBSE Board Date Sheet
    • Study Material
    • Syllabus for Class I to XII
  • CLASS 10
    • 10th Science Term-I >
      • X Chemical Reaction and Equation
      • X Acid Base and Salt
      • X Metals and Non Metals
      • X Electricity
      • X Magnetic Effects of Currents
      • X Source Of Energy
      • X Biology Term-1 >
        • 10th Life Process
        • 10th Control and coordination
    • 10th science Term II >
      • Carbon and Its Compounds
      • Periodic Classification of Elements
      • Light - Reflection and Refraction
      • The Human Eye and the Colourful World
      • X Biology Term-II >
        • How Do Organisms Reproduce ?
        • Heredity and Evolution
        • Our Environment
        • Management of Natural Resource
    • 10th Maths Term I >
      • X Real Numbers
      • X Linear Equations in Two Variables
      • X Polynomials
      • X Similar Triangles
      • X Trigonometry and Identities
      • X Statics(Mean,median and Mode)
    • 10th Maths Term II >
      • 10th Quadratic Equations
      • 10th Arithmetic Progressions
      • 10th Co-Ordinate Geometry
      • 10th Height and Distance
      • 10th Circles
      • 10th Area Related to Circles
      • 10th Surface Areas and Volumes
      • 10th Probability
      • 10th Constructions
    • 10th Social Science >
      • 10th History and Geography
      • 10th Civics and Economics
    • 10th CBSE English
    • 10th Solved Assignments
  • CLASS 9
    • 9th Science term I >
      • IX Motion and Rest
      • IX Force and Laws of motions
      • IX Gravitation
      • IX Matter in our surrounding
      • IX Is Matter around Us Pure
      • IX Biology Term-1 >
        • Cell structure n function class9
        • Tissue class9
        • Improvement in food resources class9
    • 9th Science term II >
      • Atoms and Molecules
      • Structure of the Atom
      • Thrust and Pressure
      • Work and Energy
      • Sound
      • IX Biology Term-2 >
        • Diversity in Living Organisms
        • Natural Resources
        • Why Do We Fall ill ?
    • 9th Maths term I >
      • IX Number system
      • IX Polynomials
      • IX Introduction to Euclid Geometry
      • IX Lines and Angles
      • IX Triangles
      • IX Coordinate geometry
      • IX Area of triangles by Heron's formula
    • 9th Maths term II >
      • Linear equations in two variables
      • Quadrilaterals
      • Area of Parallelogram and Triangle
      • Circle
      • Surface Areas and Volumes
      • Constructions
      • Statistics
      • Probability
    • IX Social Science >
      • 9th Social Science Term-1
      • 9th Social Science Term-2
    • IX English and Hindi
    • CBSE ASL Corner
  • IX Sample Papers
    • 9th Mid Term Papers
    • 9th Final Exam papers
    • 9th Sample Paper 2018
    • IX Sample Papers SA-I >
      • 9 Mathematics SA1
      • 9 Science SA1
      • 9 Social Science SA1
      • 9 English and Hindi SA1
    • IX Sample Paper SA-II >
      • Mathematics
      • Science
      • Social Science
      • English Hindi Sanskrit
    • IX Practical skill Science
  • X Sample Papers
    • 10th Mid Term Papers
    • 10th Board Exam Papers
    • 10th Sample Paper 2018
    • X Sample Paper SA-I >
      • X Mathematics SA1
      • X Science SA1
      • X Social Science SA1
      • 10th English sa-1 paper
      • 10th Hindiand sanskrit sa-1 paper
    • X Sample Paper SA-II >
      • Mathematics
      • Science
      • Science Practicals MCQ
      • Social Science
      • Hindi English and Sanskrit
  • CLASS 8
    • 8th Science >
      • Class 8 Physics >
        • Force Pressure and Frictions
        • Sound
        • Chemical Effects of Electric Current
        • Refraction of Light and Our Eyes
        • Some Natural Phenomenon
        • Stars and the Solar System
      • Class 8 Chemistry >
        • Synthetic fibre and Plastics
        • Metals and Non-Metals
        • Combustion ,Flame and Fuel
        • Coal Petroleum, Natural Gases
        • Air and Water Pollution
      • Class 8 Biology >
        • Crop Production and Management
        • Microorganisms friend and foe
        • Cell structure and functions
        • Reproduction in animals
        • Reaching the Age of Adolescence
        • Conservation of plants and animals
    • Class 8 Mathematics >
      • Algebra >
        • Rational Number
        • Square and Square Roots
        • Algebraic Expression
        • Factorization
        • Exponent and Power
        • Linear Equations
      • Commercial math >
        • Unitary Methods
        • Percentage
        • Profit and Loss
        • Discounts & Sales Tax
        • Compound Interest
      • Geometry/Mensuration >
        • Quadrilateral
        • Practical Geometry
        • Perimeter and Area
        • Data Handling
        • Introduction of Graphs
    • Class 8 Sample papers >
      • 8th Question paper sa1
      • 8th Question paper sa2
  • CLASS 07
    • class 7 Science >
      • class 7 Physics
      • class 7 chemistry
      • class 7 Biology
      • 7th Science Test Papers
      • 7th Science Solved Papers
    • class 7th Maths >
      • Class 07 Maths Tem-I
      • Class 07 Maths Tem-II
  • Class 06
    • 6th Maths
    • 6th science >
      • 6th Science Term-1
      • 6th Science Term-2
  • NCERT Solutions
    • X Science and Maths
    • IX Science and Maths
  • Class 11 - 12
    • 12th Sample paper
    • 11th Study Material >
      • 11th Physics
      • 11th Chemistry
      • 11th Maths
    • 12th Study Material
  • NTSE
    • NTSE SAMPLE PAPER
9th maths Ch- Statics - assignments
File Size: 454 kb
File Type: pdf
Download File

9th chapter Statics CBSE Test Paper solved New
File Size: 236 kb
File Type: pdf
Download File

9th Mean Median and Mode Test Paper-1       Download File
9th Mean Median and Mode Test Paper-2      
Download File
9th Mean Median and Mode Test Paper-3      Download File

Properties Of Arithmetic Mean Class 09
File Size: 81 kb
File Type: pdf
Download File

                  Class IX  Math  Chapter 14: Statistics Top Definitions ,Test papers NCERT  S0lution,Sample Papers
1. Facts or figures collected with a definite purpose are called data. 
2. Statistics deals with collection, presentation, analysis and interpretation of numerical data. 
3. Arranging data in a order to study their salient features is called  presentation of data. 
4. Data arranged in ascending or descending order is called arrayed data  or an array. 
5. When an investigator with a definite plan or design in mind collects  data first handedly, it is called primary data. 
6. Data when collected by someone else, say an agency  or an investigator, comes to you, is known as the secondary data. 
7. Variable is a quantity that assumes different values. 
8. Range of the data is the difference between the maximum and the  minimum values of the observations. 
9. The small groups obtained on dividing all the observations are called  classes or class intervals and the size is called the class size or class  width. 
10. Class mark of a class is the mid value of the two limits of that class. 
11. A bar graph is the diagram showing a system of connections or  interrelations between two or more things by using bars. 

12. A histogram is the bar graph such that the area over each class interval is proportional to the relative frequency  of data within this interval. 
13. The number of times an observation occurs in the data is called the frequency of the observation. 
14. A frequency distribution in which the upper limit of one class differs from the lower limit of the succeeding class is called an Inclusive or discontinuous Frequency Distribution. 
15. A frequency distribution in which the upper limit of one class coincides  from the lower limit of the succeeding class is called an exclusive or continuous Frequency Distribution. Get the Power of Visual Impact on your side  
16. A bar graph is a pictorial representation of data in which rectangular bars of uniform width are drawn with equal spacing between them on one axis, usually the x axis. The value of the variable is shown on the other axis that is the y axis. 
17. A histogram is a set of adjacent rectangles whose areas are  proportional to the frequencies of a given continuous frequency distribution. 
18. The Cumulative Frequency of a class-interval is the sum of frequencies  of that class and the classes which precede (come before) it. 
19. The mean value of a variable is defined as the sum of all the values of  the variable divided by the number of values. 
20. Median is the value of middle most observation(s). 
21. Mode of a statistical data is the value of that variate which has the maximum frequency.

22.  When constructing a histogram with non-uniform (unequal) class widths, we must ensure that the areas of the rectangles are proportional to the class frequencies.

Remember that the histogram differs from a bar chart in that it is the area of the bar that denotes the value, not the height. This means that we would need to consider the widths in order to determine the height of each rectangle.
Adjusted frequency = [(Minimum class size)x(frequency)]by Class size

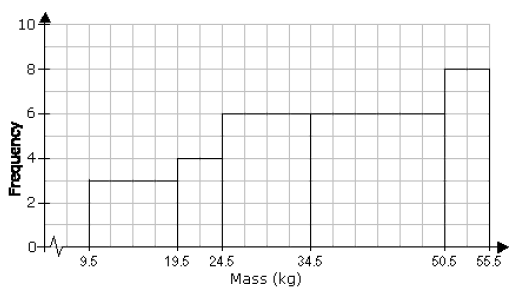
The following frequency distribution gives the masses of 48 objects measured to the nearest gram. Draw a histogram to illustrate the data.

Mass (g)

10 – 19

20 – 24

25 – 34

35 – 50

51 – 55

Frequency

6

4

12

18

8

Solution:

Evaluate each class widths. Since the class widths are not equal, we choose a convenient width as a standard and adjust the heights of the rectangles accordingly.

We notice that the smallest width size is 5. We can choose 5 to be the standard width. The other widths are then multiples of the standard width.

Mass (g)

10 – 19

20 – 24

25 – 34

35 – 50

51 – 55

Frequency

6

4

12

18

8

Class width

10

5

10

15

5

Adjusted Frequency (Rectangle’s height  in histogram)

(5/10) x 6 = 3

4

(5/10)x12=6

(5/15)x18= 6

8

Picture
Widget is loading comments...
Powered by Create your own unique website with customizable templates.